Article · Engineering
Anatomy of a $1.65B Liquidation Cascade: How Automated Margin Engines Handle Extreme Volatility

By Caleb Ngeno · November 13, 2026
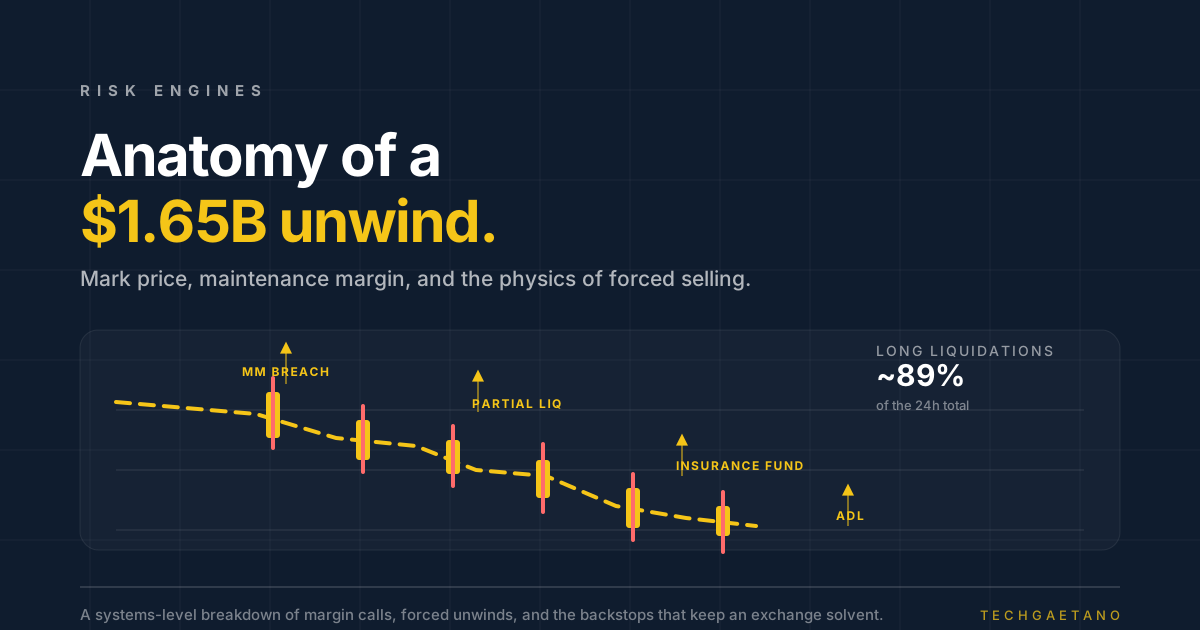
Hot US inflation data just triggered roughly $1.65 billion in crypto liquidations. The headlines call it a crash. Under the hood, it was a distributed systems stress test: thousands of leveraged accounts crossing their maintenance thresholds at almost the same moment, and a risk engine deciding what to do about each one.
That distinction matters. Price is the input. The cascade is the output of a state machine that has to calculate equity, compare it with a tiered maintenance requirement, and hand control from the trader to the exchange without making the selloff worse. When the machine works, bad debt stays contained. When it doesn't, a bad afternoon becomes an insolvency event.
This is a systems-level tour of that machine.
The macro catalyst and the flush
On November 10, the US Bureau of Labor Statistics reported that October headline CPI rose 0.4% month over month, above the 0.3% consensus, while core CPI rose 0.3% against a 0.2% expectation. The print landed on top of an already fragile market. By Friday, November 13, bitcoin had fallen below $69,000 and touched $67,449; ether slipped below $2,000. The dollar index hit a 19-month high.
Rate expectations did the rest. Bitget Wallet research lead Lacie Zhang put the probability of a December Fed rate hike at roughly 85%, up sharply after the CPI release, with higher Treasury yields pulling capital out of non-yielding risk assets. That is the macro trigger. The amplifier was leverage.
According to CoinGlass data cited across market coverage, roughly $1.6 billion in crypto positions were liquidated over 24 hours, with some trackers putting the total near $1.65 billion. Longs accounted for about $1.44–1.46 billion, or nearly 90% of the total. Between 185,000 and 186,000 traders were liquidated. The largest single liquidation was a $31.09 million bitcoin long on Hyperliquid. Binance accounted for more than a third of the total.
Those numbers are not just a market statistic. They are the observable output of thousands of concurrent risk evaluations — each one asking the same question: does this account still have enough collateral to be allowed to exist?
Core margin metrics: what the engine watches on every tick
A liquidation engine is a real-time state estimator. For every open position, on every price update, it needs to know four things: how much the position is worth, how much collateral backs it, how much collateral is required, and which price is authoritative.
Equity, used margin, and free margin
For a single position:
- Unrealized PnL = position size × (mark price − entry price), signed for direction.
- Account equity = wallet balance + unrealized PnL.
- Used margin = position notional ÷ leverage (or the isolated margin allocated to the position).
- Free margin = equity − used margin.
Notional is |size| × mark price, not the entry price. This is the first place naive implementations drift: if you calculate margin requirements from entry notional, a position that has moved against the trader will appear safer than it is.
Initial margin vs maintenance margin
Initial margin (IM) is the collateral required to open. Maintenance margin (MM) is the collateral required to keep the position open. The gap between them is deliberate. It gives the engine a buffer to act before the account is actually bankrupt.
MM is usually tiered by notional. A small position might require 0.5% maintenance margin; a position large enough to threaten the order book might require 2.5% or more. Exchanges express this with a maintenance margin rate (MMR) and, on some venues, a maintenance amount that adjusts the formula at tier boundaries.
A simplified formula:
MM = max(0, notional × MMR(tier) − maintenanceAmount(tier))
The tiering is a risk control disguised as a fee schedule. Bigger positions are harder to liquidate without moving the market, so they must post more collateral. When a position grows past a tier boundary, its maintenance requirement jumps. That jump can push a healthy-looking account straight into liquidation.
| Notional (illustrative) | MMR | Maintenance amount |
|---|---|---|
| Up to $50,000 | 0.50% | $0 |
| $50,000–$250,000 | 1.00% | $250 |
| $250,000–$1M | 2.50% | $4,000 |
| Above $1M | 5.00% | $29,000 |
Rates are illustrative, not a specific venue's schedule. Always read the contract specifications.
Mark price vs last price
The engine does not use the last traded price to trigger liquidations. It uses a mark price: an index of spot prices across multiple venues, often adjusted by a basis component derived from the futures market.
The reason is manipulation resistance. A single aggressive order on a thin book can print a wick that exists for 200 milliseconds. If liquidation were triggered by that print, an attacker could force a wave of liquidations at a price nobody else could trade at. The mark price smooths the input and gives the engine a fair-value reference that is harder to move.
This is why a trader can see a last price of $68,900 while the engine liquidates at a mark price of $69,400, or why a position's displayed liquidation price can differ from the price at which it actually closes. The mark price is not linear, and volatility widens the gap.
Binance's own documentation describes the split cleanly: last price is the latest trade, used for realized PnL; mark price combines funding data and a basket of spot prices, and is used for liquidation prices and unrealized PnL. That design choice is the difference between a liquidation engine and a wick-hunting machine.
The three tiers of margin deterioration
The engine's decision logic is a state machine, not a single threshold. Different venues use different names, but the states are broadly the same.
Tier 1: early warning
As the margin ratio narrows, the account enters a warning state. Nothing is forced yet. The user may see a notification, an in-app banner, or a higher risk indicator. The engineering goal here is to create time: a warning is cheaper than a liquidation for everyone.
Tier 2: the margin call
The account is now close to the maintenance threshold. The venue formally asks for more collateral or a reduction in exposure. Some platforms restrict new orders, cancel open orders, or switch the account to reduce-only. This is the last state in which the user still controls the position.
Tier 3: forced liquidation
The moment equity falls to or below maintenance margin, the engine takes over. The exact trigger depends on the venue's convention — some express it as margin ratio reaching 100%, others as equity ≤ MM — but the meaning is the same: the exchange can no longer let the position run.
A clean evaluation loop looks like this:
type Tier = { maxNotional: number; mmr: number; maintenanceAmount: number };
type Position = {
  size: number;        // positive long, negative short
  entry: number;
  collateral: number;
  tiers: Tier[];
};
type Decision =
  | { action: "hold" }
  | { action: "warn"; marginRatio: number }
  | { action: "margin_call"; marginRatio: number }
  | { action: "liquidate"; reason: "maintenance" | "bankrupt"; marginRatio: number };

function maintenanceMargin(notional: number, tiers: Tier[]): number {
  const tier = tiers.find((t) => notional <= t.maxNotional) ?? tiers[tiers.length - 1];
  return Math.max(0, notional * tier.mmr - tier.maintenanceAmount);
}

function checkLiquidation(p: Position, mark: number): Decision {
  const notional = Math.abs(p.size) * mark;
  const uPnl = p.size * (mark - p.entry);
  const equity = p.collateral + uPnl;
  const mm = maintenanceMargin(notional, p.tiers);

  // marginRatio = maintenance margin / equity; >= 1 means liquidate
  if (equity <= 0) return { action: "liquidate", reason: "bankrupt", marginRatio: Infinity };
  const marginRatio = mm / equity;
  if (marginRatio >= 1) return { action: "liquidate", reason: "maintenance", marginRatio };
  if (marginRatio >= 0.8) return { action: "margin_call", marginRatio };
  if (marginRatio >= 0.6) return { action: "warn", marginRatio };
  return { action: "hold" };
}
Real engines add funding payments, borrow interest, cross-collateral haircuts, and portfolio margin offsets. The shape stays the same: a deterministic function from position state and mark price to an action.
The hard part is not the formula. It is running it for every account, on every symbol, on every tick, without letting one slow shard delay a liquidation that another shard needs to execute now.
Inside the cascade: why liquidations snowball
A liquidation cascade is a feedback loop between a risk engine and an order book. It unfolds in three phases.
Phase 1: shock and order dumping
The CPI print hits. Longs that were comfortable at $73,000 are suddenly underwater at $71,000, then $69,000. As mark price crosses maintenance thresholds, the engine's decision function flips from hold to liquidate for thousands of accounts at once.
The engine cancels open orders and submits reduce-only sell orders. If those orders are marketable, they hit the bid. If the book is thin, they walk it down. Every fill that prints below the previous mark drags the index and the mark price lower, which pushes the next cohort of accounts over the line.
This is the crucial systems property: liquidations are not independent events. The engine's output changes its own input.
Phase 2: slippage, stale marks, and feedback
A well-designed engine tries to avoid dumping the whole position at once. It may submit an immediate-or-cancel limit order at or near the mark price, or split a large position into chunks. But in a fast market, the order may not fill. The engine then has a choice: chase the price down, or hold the residual and accept that the position is now undercollateralized.
This is where the bankruptcy price matters. It is the price at which a position's losses equal its remaining collateral. If the engine fills worse than the bankruptcy price, the account's equity goes negative, and the shortfall has to go somewhere. If it fills better, the surplus may go to the insurance fund.
Latency makes this worse. A mark price that is 500 milliseconds stale during a $2,000 move is not a fair-value estimate; it is a lagging indicator. The engine liquidates based on a price that no longer exists, the fill is worse than expected, and the gap between displayed risk and realized risk widens.
Phase 3: absorption and convergence
Eventually, forced selling exhausts itself. Market makers, arbitrageurs, and basis traders step in when the futures price dislocates from the index. Funding rates flip. The order book refills. Volatility mean-reverts, at least for a while.
In this week's case, the absorption was uneven. Bitcoin liquidations dominated at roughly $915 million, with ether at about $294 million. More than 185,000 traders were flushed out. That is what a leverage reset looks like: violent, concentrated, and largely complete before the headlines catch up.
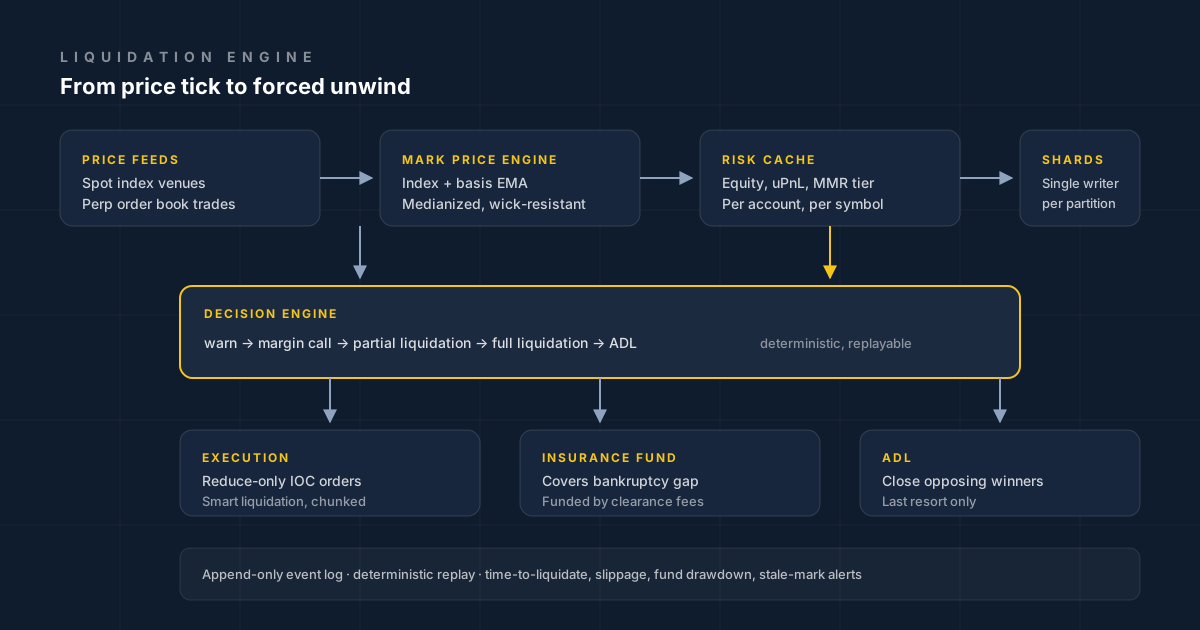
Backstops against exchange insolvency
The cascade is only half the story. The other half is what happens when a position cannot be closed before its equity hits zero. A solvent exchange needs a waterfall of backstops.
Partial and tiered liquidation
Closing 100% of a large position at once is the most expensive way to liquidate. Modern engines often reduce a position in stages: close enough to move the account into a lower risk tier, then reassess. This lowers the immediate market impact and can leave the trader with a smaller position instead of nothing.
Binance calls its version "Smart Liquidation" and says it tries to avoid full liquidation where possible. The implementation details differ by venue, but the principle is general: minimize the size of the forced order, not just the time to execute it.
The insurance fund
The insurance fund covers the gap between the bankruptcy price and the actual execution price of a bankrupt position. It is funded by liquidation clearance fees and, depending on the venue, other revenue. It is not customer insurance, and it does not reimburse traders for their losses. It protects the exchange's solvency so that one bad liquidation does not become everyone's problem.
Binance's documentation is explicit that its futures insurance funds are calibrated using a 99.9% confidence interval and historical stress scenarios, and that the fund is not a guarantee against ADL. That is the right way to read any insurance fund: a buffer sized for extreme-but-plausible conditions, not a promise that extreme conditions will never exceed it.
Auto-deleveraging (ADL)
If the insurance fund cannot absorb the bankrupt position, the engine moves to the last resort: auto-deleveraging. It forcibly closes profitable opposing positions, selected by a ranking that typically weighs profit and leverage, at the bankrupt trader's bankruptcy price. The winning trader is notified; the position is closed whether they wanted it closed or not.
ADL is a solvency mechanism, not a fairness mechanism. It externalizes the cost of the failure onto the traders who happened to be on the other side. That is why exchanges try hard to avoid it, and why the ADL indicator is worth watching if you trade leveraged products.
The waterfall looks like this:
- Trader equity absorbs the loss first.
- Forced liquidation closes the position at the best available price.
- Insurance fund covers any shortfall between bankruptcy price and fill price.
- ADL closes opposing winners if the fund is exhausted.
- Socialized losses or emergency measures if all else fails.
Steps 4 and 5 are the ones that turn a market event into a platform event. The engineering goal is to make sure the cascade never reaches them.
Engineering takeaways for risk and trading systems
The macro story will fade. The architectural lessons will not.
1. Volatility-adjusted sizing
Static leverage is a bug during macro releases. A 20x position that is safe in a 1% daily range is not safe in a 5% range. Scale maximum leverage and position limits inversely with realized volatility, and tighten them ahead of scheduled events like CPI, PPI, and FOMC. If your risk model only updates on a daily cron, it is already stale when the print lands.
2. Correlation kill switches
BTC and ETH fell together. Solana and XRP followed. In a risk-off shock, diversification across crypto assets is often weaker than it looks. Track correlated exposure at the portfolio level, not just per symbol. If aggregate beta to a single factor crosses a threshold, reduce new risk automatically rather than waiting for a human to notice.
3. Sub-millisecond latency and sharding
A liquidation engine that processes 10,000 accounts per second is fine on a quiet Tuesday and useless during a cascade. Partition accounts by shard, keep a single writer per partition, and use a deterministic event log so that every shard can replay the same sequence. Avoid global locks on the order book. The goal is not raw throughput; it is predictable tail latency when every shard is busy at once.
4. Idempotency and exactly-once execution
A liquidation that executes twice is worse than one that executes late. Use client order IDs, an outbox pattern, and reconciliation against fills. Write the liquidation decision and the resulting order to the same durable log so a crash mid-flight cannot produce two conflicting actions.
5. Staged degradation, not binary shutdown
When load spikes, the worst response is to disable risk checks to keep the API responsive. Instead, degrade in stages: reject new leverage, widen maintenance requirements, cancel non-critical order types, and keep liquidation and withdrawal controls online. The risk engine should be the last thing you turn off, not the first.
6. Risk SLOs and observability
Measure the things that matter in a cascade:
| Metric | Why it matters |
|---|---|
| Time from threshold breach to order submission | The core latency SLO |
| Liquidation slippage vs mark price | Reveals book depth and engine behavior |
| Insurance fund drawdown | Early warning of bad-debt accumulation |
| ADL count and notional | Last-resort activation |
| Mark/index divergence and stale-mark age | Detects oracle and feed problems |
| Failed or partial liquidations | Indicates execution gaps |
Alert on these like you would alert on 5xx rates. A risk engine that is "up" but calculating stale equity is down.
7. Replay the tail, not the average
Backtests that use normal-market fills will understate liquidation risk. Replay historical cascades, stress the order book with realistic depth and latency, and simulate the feedback loop where your own liquidations move the mark price. If your model assumes infinite liquidity at the mark, it is not a risk model; it is a wish.
What this means if you trade leverage
- Watch the mark price, not just the chart. Liquidation is triggered by the engine's reference price, and the two can diverge in volatility.
- Know your tier. A position that crosses a notional tier can see its maintenance requirement jump. Size below the boundary if you want a buffer.
- Treat the ADL indicator as a real risk. In an extreme event, profitable positions can be closed to cover someone else's bankruptcy.
- Assume the exit is narrower than the entry. Liquidity is a fair-weather friend. The order book you see at $73,000 is not the order book you get at $68,000.
- Respect macro calendars. CPI, PPI, and FOMC releases are scheduled volatility events. Reducing leverage before them is cheaper than discovering the cascade from the inside.
The same control-plane lessons from the Binance custody breach apply here: the failure is rarely in the asset; it is in the system that authorizes movement. And the dependency lessons from this week's cloud outages apply too: when one component degrades, the recovery path must not depend on it.
The bottom line
The $1.65 billion liquidation cascade was triggered by a CPI print, but it was executed by software. Thousands of accounts crossed their maintenance thresholds, the risk engine did what it was designed to do, and the market absorbed the forced flow — barely.
The lesson is not that leverage is bad or that crypto is uniquely fragile. It is that market crashes are inevitable, and the systems that survive them are the ones that enforce deterministic risk guardrails at speed. You cannot predict the next macro surprise. You can decide, in advance, what your engine will do when it arrives.
Work with TechGaetano
If you are building or reviewing a risk engine, a trading backend, or any system where a late decision becomes an expensive one, TechGaetano can help. We work with teams on architecture, latency, failure modes, and the controls that keep a bad day from becoming an outage.
Work with TechGaetano to pressure-test your design before the next volatility event.
Sources
- US Bureau of Labor Statistics: Consumer Price Index — October 2026
- CME FedWatch Tool
- CoinGlass: Liquidation data
- Crypto Briefing: Bitcoin risks falling to $62,000 as Fed hike odds climb
- Cointribune: Bitcoin crashes below $69,000 as extreme fear grips the market
- Stocktwits: Bitcoin breaks below $69K, long bets take $1.4B hit
- Binance: Futures liquidation protocols
- Binance: Introduction to futures insurance funds
- Binance: What is auto-deleveraging (ADL)?
- Binance Academy: Mark price

About the author
Caleb Ngeno
Lead Developer
Founder and lead developer with expertise in full-stack development and cloud solutions.
Need senior engineering firepower?
TechGaetano partners with teams on architecture, delivery, and the hard technical decisions that shape the next stage of a product.
Work with TechGaetanoFrequently asked questions
What is Anatomy of a $1.65B Liquidation Cascade?
Hot US inflation data just triggered roughly $1.65 billion in crypto liquidations. The headlines call it a crash. Under the hood, it was a distributed systems stress test: thousands of leveraged accounts crossing their maintenance thresholds at almost the same.
How should a team get started with Anatomy of a $1.65B Liquidation Cascade?
Start with the problem and its constraints, then choose the smallest tool that solves it. Build a small proof, measure the result, and expand only when the evidence supports it.
What should teams avoid when working on Anatomy of a $1.65B Liquidation Cascade?
The main risks are choosing tools by fashion, optimizing for the demo instead of production, and skipping measurement before expanding a technical bet.
Further reading
Related posts

The $6.3 Billion Binance Hack: Frozen Funds, Recoveries, and the Myth of Crypto Security
The short version On October 29, 2026, Binance disclosed what is now the largest crypto theft on record. The exchange estimated the impact at roughly…

Moving to the Cloud: Five Security Mistakes That Cost Banks and SACCOs Millions
Cloud migration is no longer a strategic experiment for financial institutions. It is the operating model. In Kenya, the Central Bank's 2025 innovatio…